
The roles of full-backs and wing-backs have changed significantly in recent years, with these players typically covering more distance than other defenders and running at a higher intensity, reflecting their ability in both offense and defense
So, how much more ground do they cover compared to other defenders? What are the differences between the running patterns of different types of defenders?
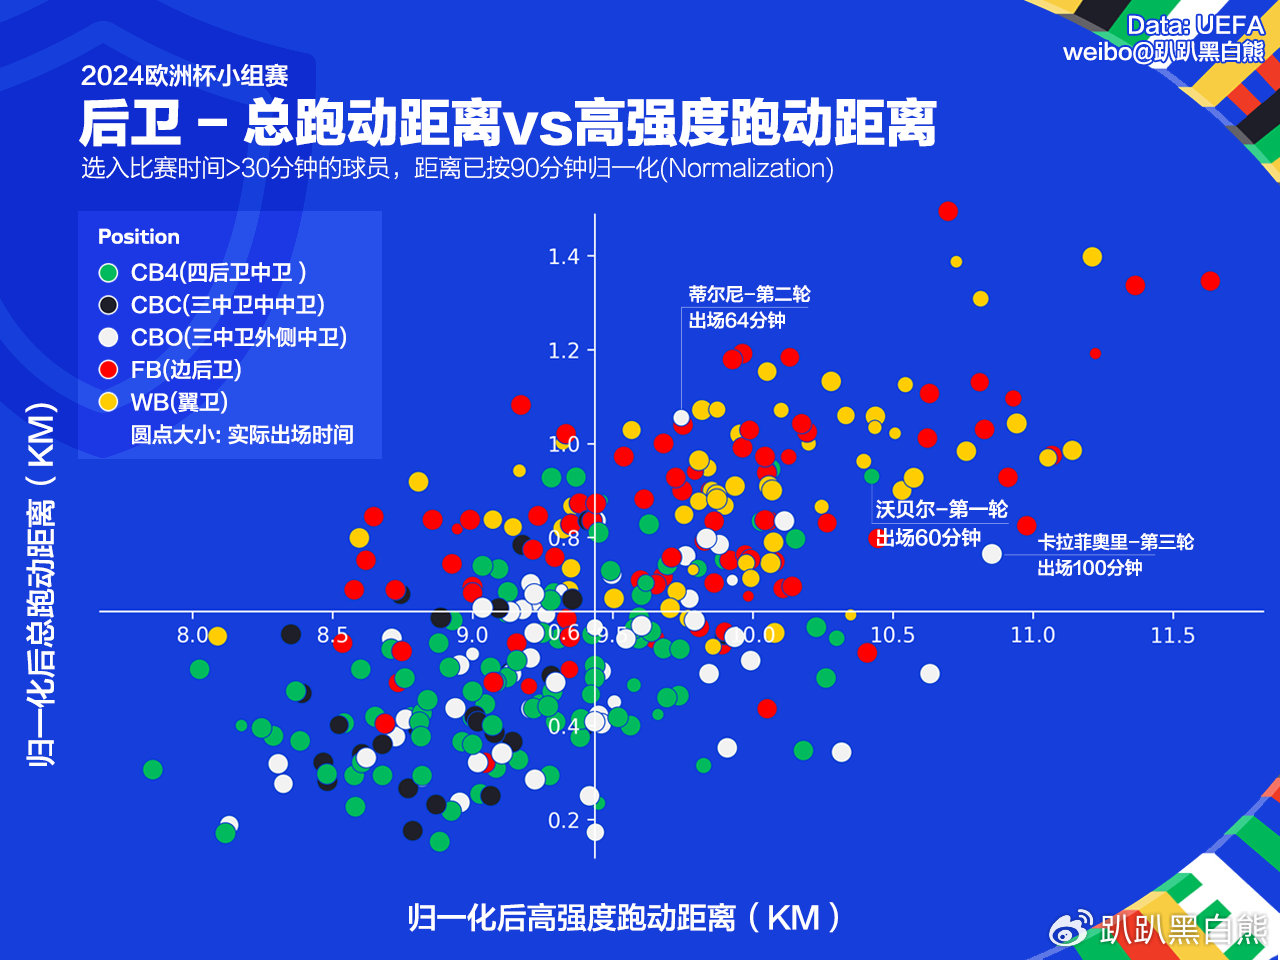
Figure 1: 2024European Championship defender running analysis in the group stage
From the experience of watching the game, it is obvious that the running intensity of the full-back and wing-back (high-speed running + sprint distance) is significantly higher than that of the central defender; interestingly, in statistics, The median running intensity forms a natural boundary, distinguishes full-backs and wing-backs from most central defenders.
In addition, the running distance and high-intensity running of wing backs are slightly higher than that of full backs. Unlike full-backs who have midfield support in a back four, wing-backs usually lack the wide midfielders to share the workload and therefore need to cover more distance and provide higher intensity to complete defensive and offensive tasks.
When discussing center backs, the author divides center backs into three categories:
- CBC (center defender in a three-back system)
- CBO (outside center back in a three-back system)
- CB4 (center back in a four-back system).
CBC has the lowest intensity and running distance, reflecting that its main responsibility is sit-back to maintain a solid defensive structure.
CBO is more dynamic in the game. Depending on the team's tactical arrangements, some CBO will cross the center line or even go to the opponent's third zone to actively press, making a huge contribution to the team's organization and advancement.
CB4's intensity and running distance vary greatly, and it has the characteristics of both CBC and CBO. This also reflects that the responsibilities of the two central defenders in the four-back system are usually allocated based on communication between teammates and coaching arrangements.
Heterogeneous central defender
Kieran Tierney (CBO-MD2, 1997, 180cm, left foot)
Served as a left back (LB) for most of his career, but mainly played as a left central defender (LCB) in the national team. In Scottish tactics, Tierney's actual role is similar to Scotland's second wing-back, and he is very important on both offense and defense.
Maximilian Wobbel (CB4-MD1, 1998, 188cm, left foot)
Plays for the Austrian national team and is known for pressing in the middle and actively grabbing the ball. Wobble's passing quality is good, and he runs smart without the ball. He can often meet his teammates in a suitable position to receive the ball, thereby helping the team advance. His career playing for many countries and clubs has also demonstrated his adaptability. Despite scoring an own goal, his active role in defense is still worthy of attention.
Riccardo Calafiore (CBO-MD3, 2002, 188cm, left foot)
He serves as a versatile left back (LB) and left central defender (LCB) at Bologna Club. Calafiore is known for his excellent defensive habits, tactical awareness, and mobility. Although he also scored an own goal, his fearless attack in his own penalty area and wide coverage made him a key player in Italy. In the game when Italy was eliminated by Switzerland, the Italian defense without Calafio highlighted his importance.
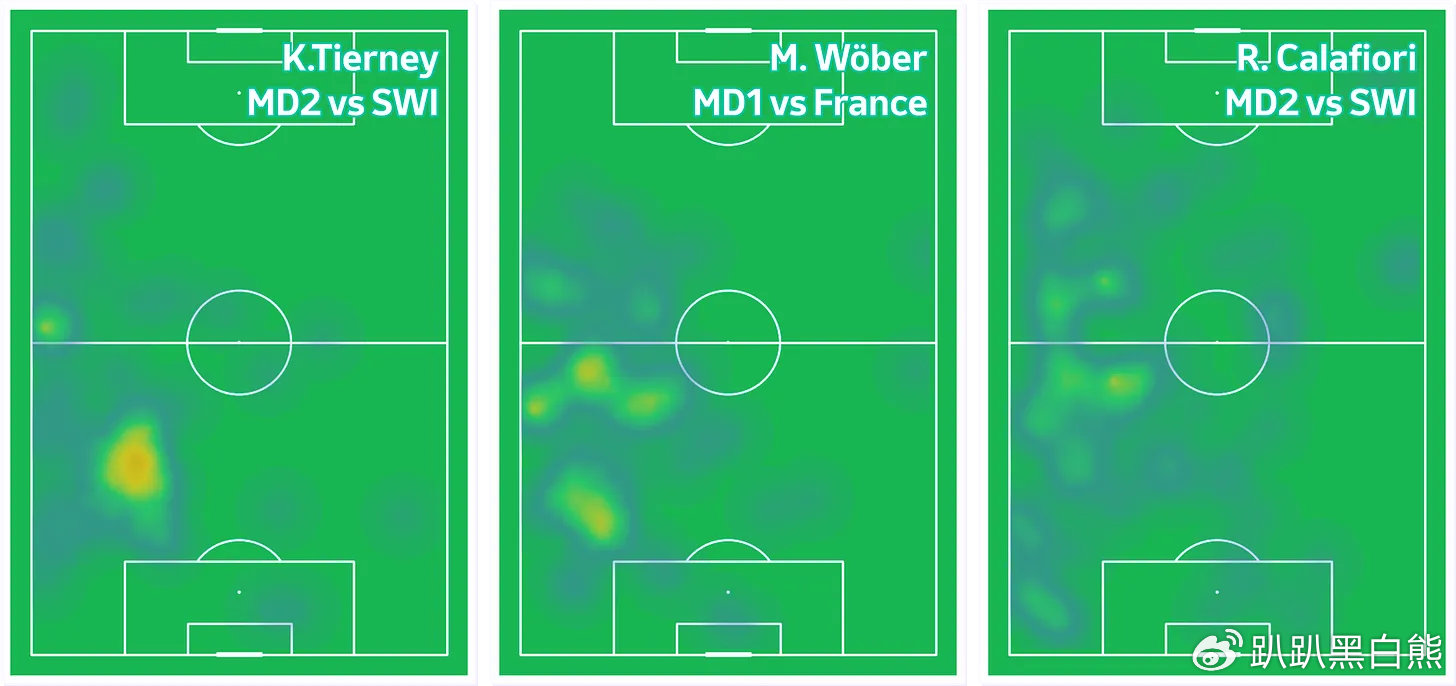
Figure 2: Tierney, Warber, Calafiore heat map
Limitations of defender relay and normalization
As discussed above, after normalization, the high-intensity running distance and total distance of full-backs/wing-backs are usually higher than that of central defenders. However, not all full-backs and wing-backs can play the entire game, especially those who run more intensively.
The size of the dots in Figure 1 indicates the length of time each player participates in the game. Some high-intensity FBs and WBs usually only play for about 30-60 minutes in the game. Since the introduction of the five-change rule, in order to maintain the team's output, the phenomenon of defensive players, especially fullbacks/wingbacks, relaying has become increasingly common during the game. Therefore, coaches need to consider the maximum demands of the game and the load capacity of the players to further optimize the training design to adapt to the requirements of the intensity of the game.
Usually, in the baseline analysis of physical requirements based on individual players, only players who have played more than 90 minutes will be selected. This is due to the dynamic nature of the game, which means that physical fitness indicators may not necessarily reflect the actual consumption and maximum load of the players after being simply scaled by the normalization method per 90 minutes.
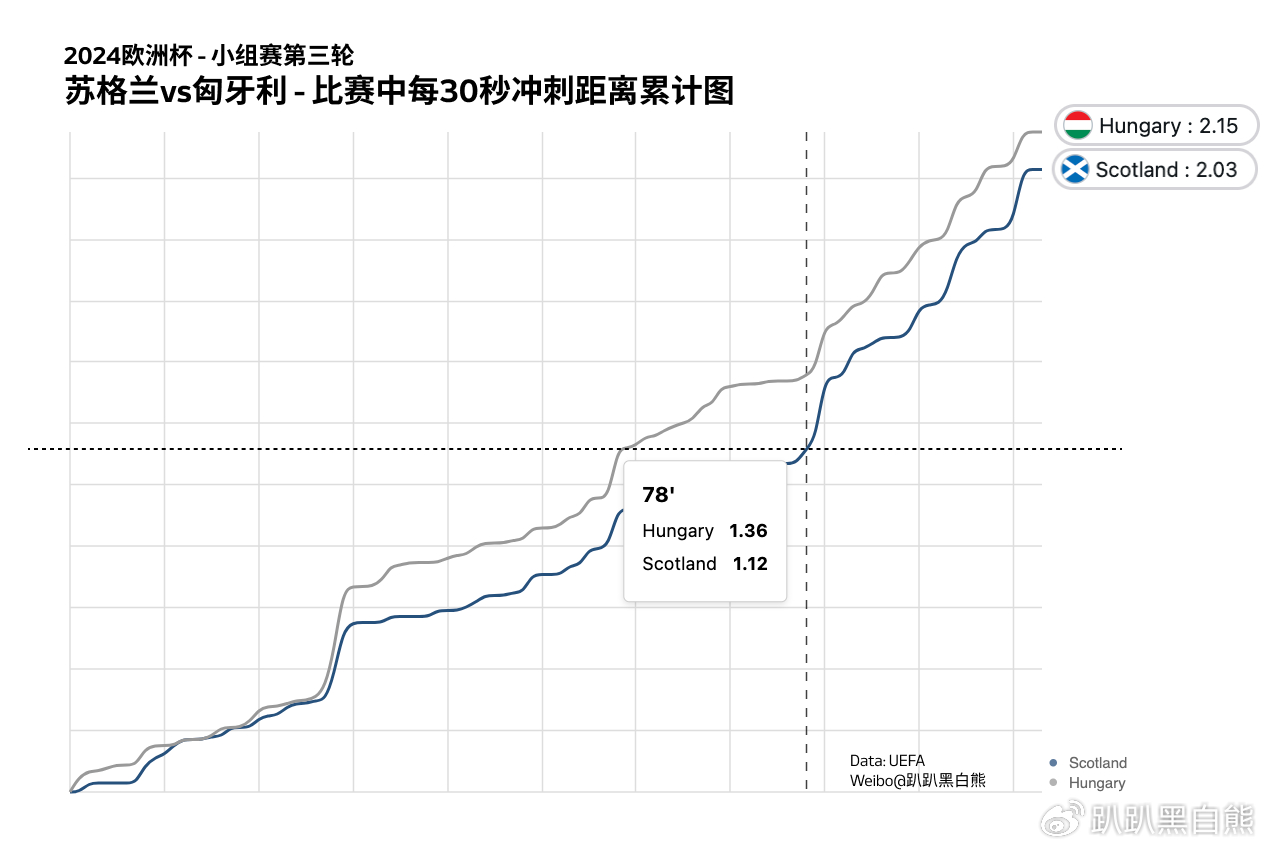
Figure 3: Scotland vs Hungary sprint distance accumulation per 30 seconds
The match between Scotland and Hungary is a perfect example of the limitations of the per 90 minute normalization method in physical-performance data. In a rare game where players relied almost on instinct in the closing stages, Scotland ran 46% of their total sprint distance after the 78th minute. For players from both sides who came off the field early or came on as substitutes, it is not appropriate to simply process the intensity of the game every 90 minutes based on their performance before coming off the field or based on their performance after coming on as substitutes.
However, one of the biggest limitations in the field of physical analysis is that the sample size is too small to analyze statistical significance. Although there are limitations in simply normalizing the running volume of players who play for less than 90 minutes based on 90 minutes due to reasons such as tactics, weather, game conditions, player mentality, etc., taking into account the relay situation of wide players and with the purpose of including as many samples as possible, this is still an effective method to establish a preliminary benchmark.
Therefore, in order to avoid extreme situations, only players who played at least 30 minutes are included in Figure 1. With real-time physical-performance data, fitting based on the movements of the entire team or players with similar roles may be a more reliable method. If you are interested in discussing better normalization methods and designing better player running benchmarks, please feel free to leave a message.